
Abstract:
Dice are most commonly used in casinos for gambling. In this experiment, two dice will be rolled 100 times and recorded. This study aims to determine the chance of rolling a predicted number at the start of the experiment and how often it will appear within the 100 rolls. This study had shown the most probable combination sum to appear was the sum of 7. Further experiment should be completed to validate the results.
Introduction:
Dice are commonly used in games and the traditional type of dice used is the cube die. The die has different numbers on each of its faces starting from one to six. When rolled on to a surface, the die will come to a resting position and one of six integers will be shown on the top of the die. In gambling, outcome is predicted ranging from one to twelve and a player has won when the predicted outcome matches with the sum of the two dice rolled. But what if a player wanted to increase the chance of winning, and want to predict the most common outcome? According to Scott Johnsen’s table, the highest outcome probability is the sum 7. (Johnsen, 2009) Scott Johnsen discovers that there are 6 ways to sum up to 7 with two dice while other sums have less than 6 ways. The following table will define the number of ways each summed number can be shown with the bolded numbers showing the number on the face of each dice:
Table 1
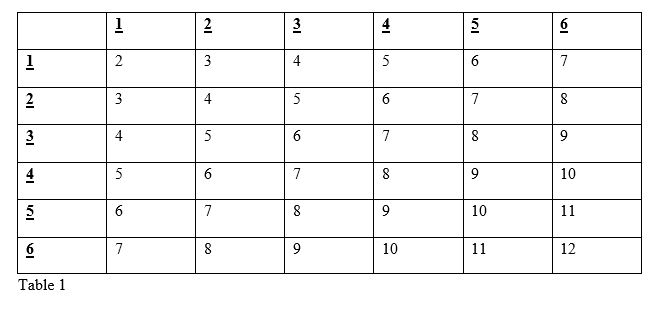
As you can see the sum of 7 shows up most often in Table 1, therefore in this experiment we predict the outcome 7, from the sum of two dice will appear most often throughout the trials.
Materials:
- Dice: To roll and obtain outcome sums
- Notebook or Computer: To record results
Methods:
- To start, roll two dices on an open flat surface.
- When dice is in a resting position record the two numbers that appear on top of the dice.
- Repeat steps one and two, 100 times.
- Sum the two numbers obtained in each trial and record the outcome.
- Construct a bar graph with the results.
Results:

Fig. 1

Analysis:
The result obtained from this experiment corresponded with our hypothesis. The sum of 7 has appeared the most often because there were more ways to obtain a sum of 7. The results have also shown that the sum of 5,6,7, and 9 has appeared often as well further supporting Table 1; the graph increases from the left and reaches a peak at the sum value of 7 and then goes back down. However, further trials should be done to enhance the results. According to the trials in Darin Beigie’s experiment, the students have found different results than their theoretical graph. (Beigie, 2010) The students have found that 7 was not the most often rolled sum, instead the sum of 5,6, and 8 were found most often in a 100-roll experiment. Therefore, in order to produce a more accurate result more trials should be taken.
Conclusion:
The goal of this lab was to find the most probable sum of rolling two dice. Two dices were rolled 100 times and was found that the sum of 7 from two dice occurred most often. The experiment has proven the theoretical hypothesis to be true.
Citations:
Beigie, D. (2010). Mathematics Teaching In The Middle School (8th ed., Vol. 15).
Johnsen, S. (2009). Sicherman Dice. Retrieved March 17, 2019, from https://digitalcommons.unl.edu/cgi/viewcontent.cgi?article=1018&context=mathmidexppap